PMS – Dashboard User Guide
1. Overview
This PMS – Dashboard User Guide provides hotel staff and system users with clear, step-by-step instructions on how to view and manage various operational aspects of the hotel in real time. The guide covers key functions such as tracking occupancy, arrivals, departures, guest preferences, and financial data, all from within the PMS Dashboard. It aims to ensure efficient hotel operations and effective decision-making through accessible, live data updates.
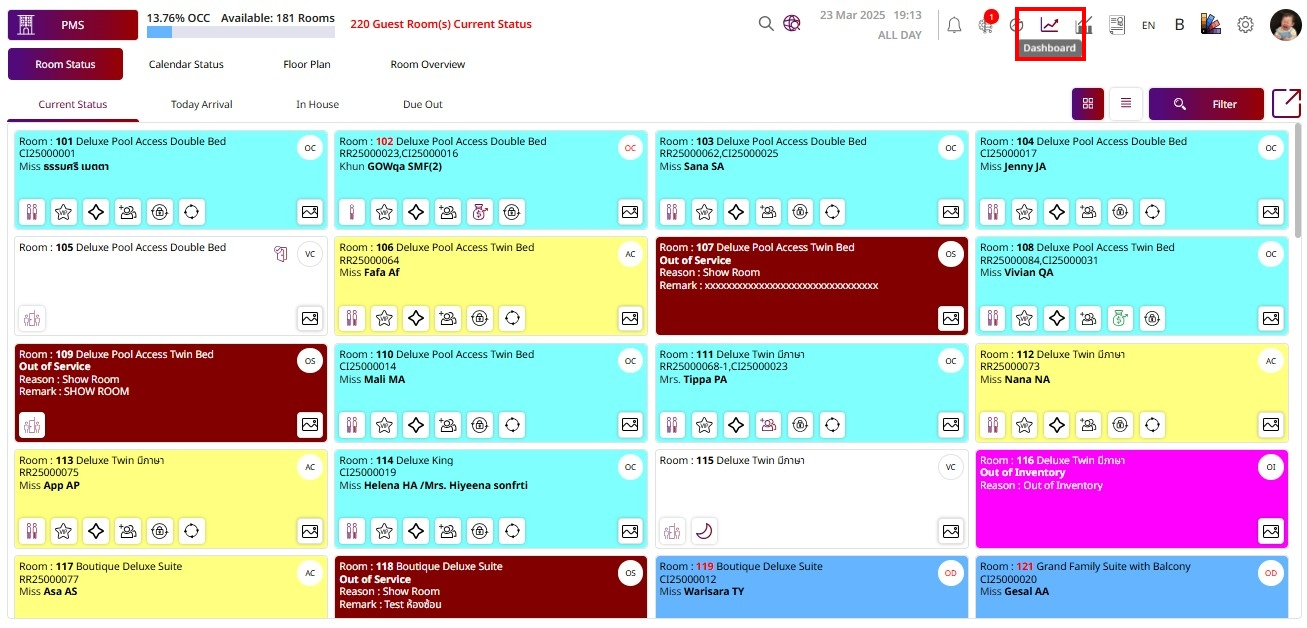
2. Live Hotel
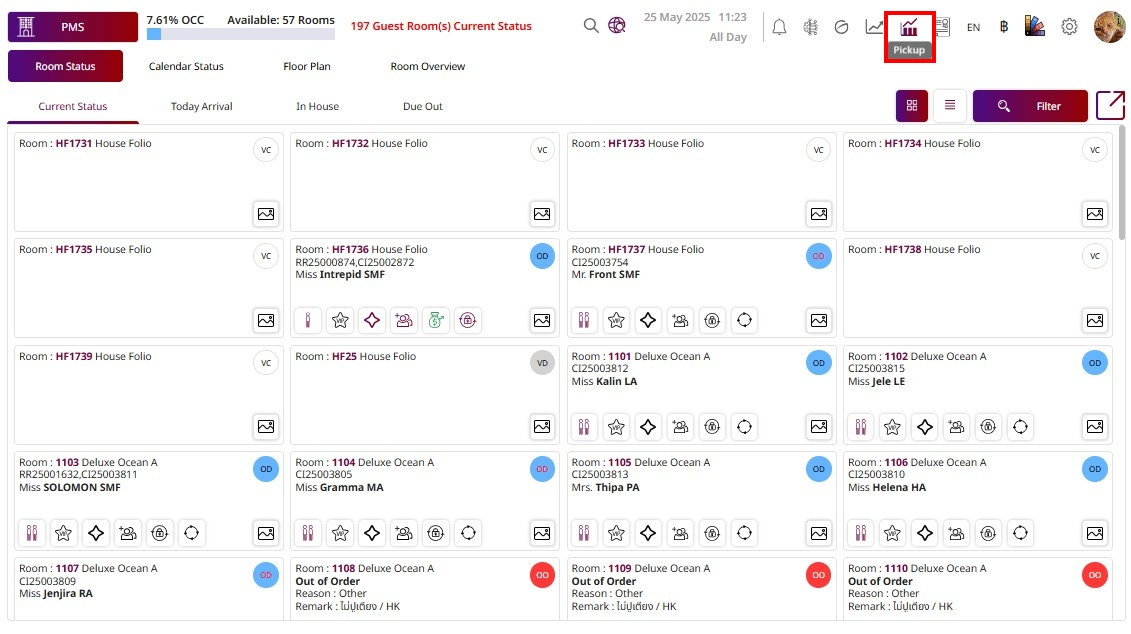
Available under PMS > Dashboard > Live Hotel , this function allows staff to view real-time operational data, including occupancy, arrivals, departures, and other important hotel statistics.
To perform the task:
- Press the Dashboard icon.
- Press the Live hotel tab.
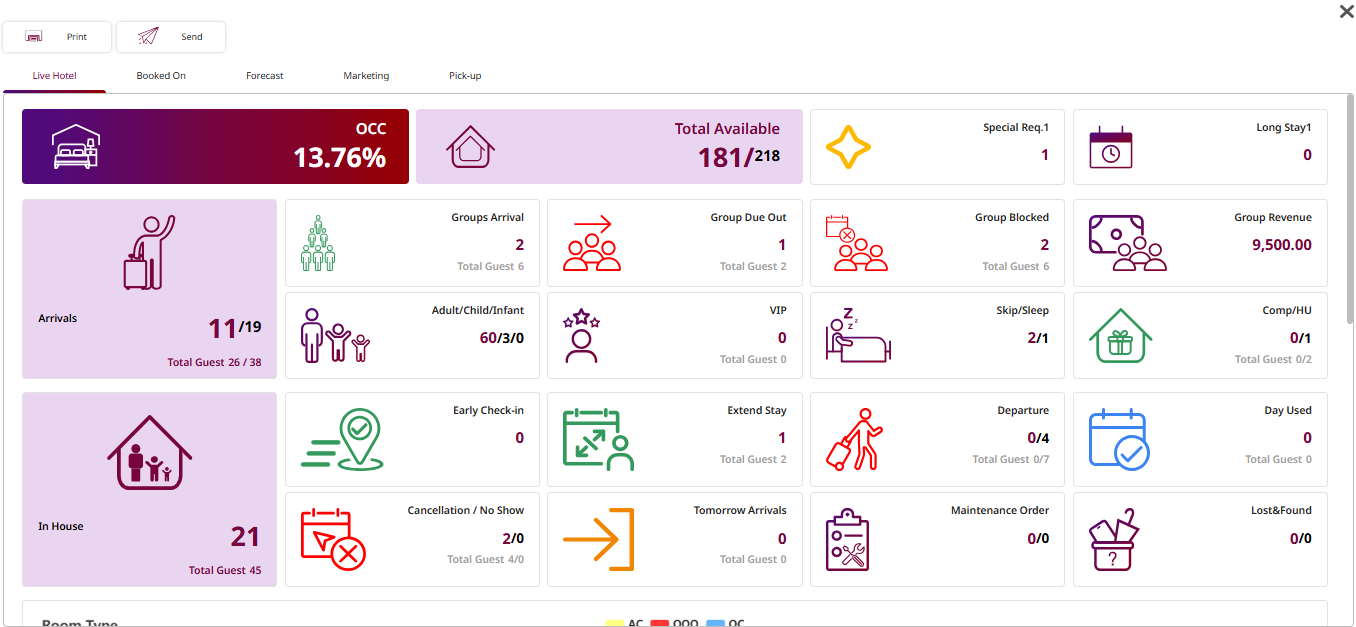
- View the information:
- OCC (Occupancy) : Current occupancy percentage.
- Total Available : Number of available rooms vs. total rooms.
-
Special Req. : Number of bookings with special requests.
-
Long Stay : Guests staying for extended periods.
-
Arrivals : Number of check-ins today, with total guests.
-
Groups Arrival : Number of arriving groups.
-
Group Due Out : Groups scheduled to check out today.
-
Group Blocked : Group bookings with blocked rooms.
-
Group Revenue: Total revenue from group bookings.
-
Adult / Child / Infant : Breakdown of guests currently in-house.
-
VIP : Number of VIP guests.
-
Skip / Sleep : Skip = Guests who left without checking out.
Sleep = Guests staying without checking in.
-
Comp / HU : Complimentary rooms / House Use rooms, with total guests.
-
In House : Rooms currently occupied.
-
Early Check-in : Guests checked in before the Check-in time.
-
Extend Stay : Guests extending their stay.
-
Departure : Checked-out rooms vs. scheduled departures, total guests.
-
Day Used : Day-use rooms.
-
Cancellation / No Show : Cancellations / No-shows/ total guests.
-
Tomorrow Arrivals : Bookings scheduled to arrive tomorrow.
-
Maintenance Order : Pending maintenance jobs.
-
Lost & Found : New lost & found records.
-
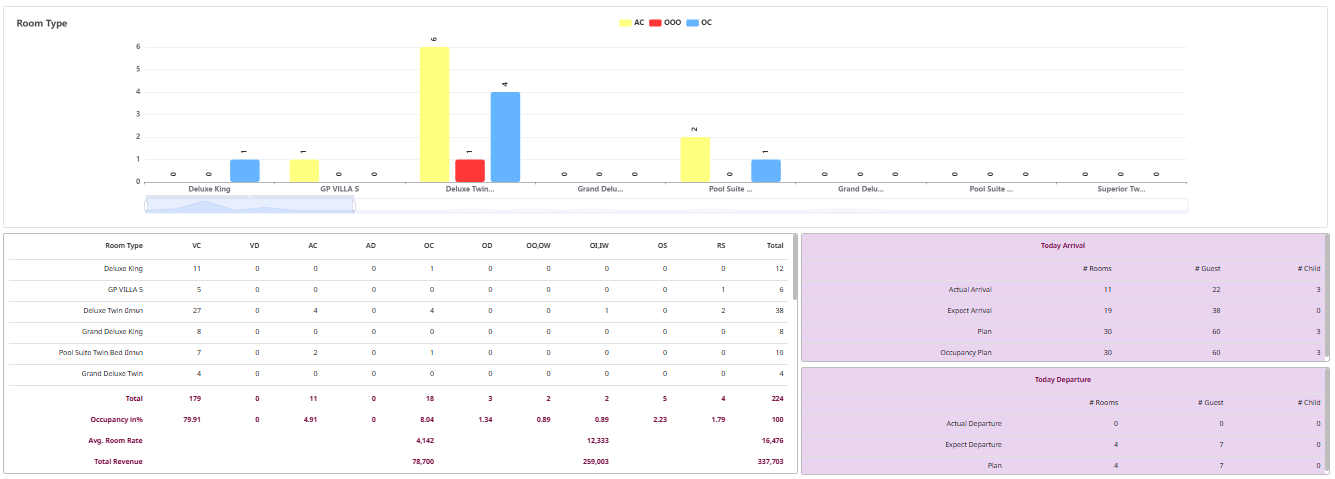
View the information:
- VC: Vacant Clean (ready for sale).
- VD: Vacant Dirty (needs cleaning).
- AC: Booking Assigned Clean.
- AD: Booking Assigned Dirty
- OC: Occupied Clean.
- OD: Occupied Dirty.
- OO: Out of Order (Deduct Room Available).
- OW: Out of Order Warning.
- OI: Out of Inventory (Deduct Room Inventory).
- IW: Out of Inventory Warning.
- OS: Out of Service (Not Deduct Room Available).
- RS: Reserve.
- Total: Total rooms for that room type
- Occupancy % : Occupancy rate by room status and total occupancy.
- Avg. Room Rate : Average rate per night for booked , In house , Booked and In house.
- Total Revenue : Revenue generated from that room type.
-
Today Arrival :
- Actual Arrival: Rooms and guests already checked in today.
- Expected Arrival: Rooms and guests expected to check in today.
- Plan: Total planned arrivals for today.
- Occupancy Plan: Planned occupancy after today’s arrivals and departures.
-
Today Departure :
- Actual Departure: Rooms and guests already checked out today.
- Expected Departure: Rooms and guests expected to check out today.
- Plan: Total planned departures for today.
-
Press Print to generate and print the dashboard report.
Press Send to send the dashboard report via the configured delivery method.
3. Booked On
Available under PMS > Dashboard > Booked On , this function allows staff to view current bookings by market segment and booking status for the selected date.
To perform the task:
- Press the Dashboard icon.
- Press the Booked On tab.
- 29 / 218 : Total booked rooms out of the total available rooms.
- 13.3% : Current booking percentage based on total room inventory.
- Market Segments : Color Codes
- Green : Confirmed bookings.
- Orange : Tentative bookings.
- Red: Cancellations.
- Black: Waiting list bookings.
- Press Print to generate and print the dashboard report.
- Press Send to send the dashboard report via the configured delivery method.
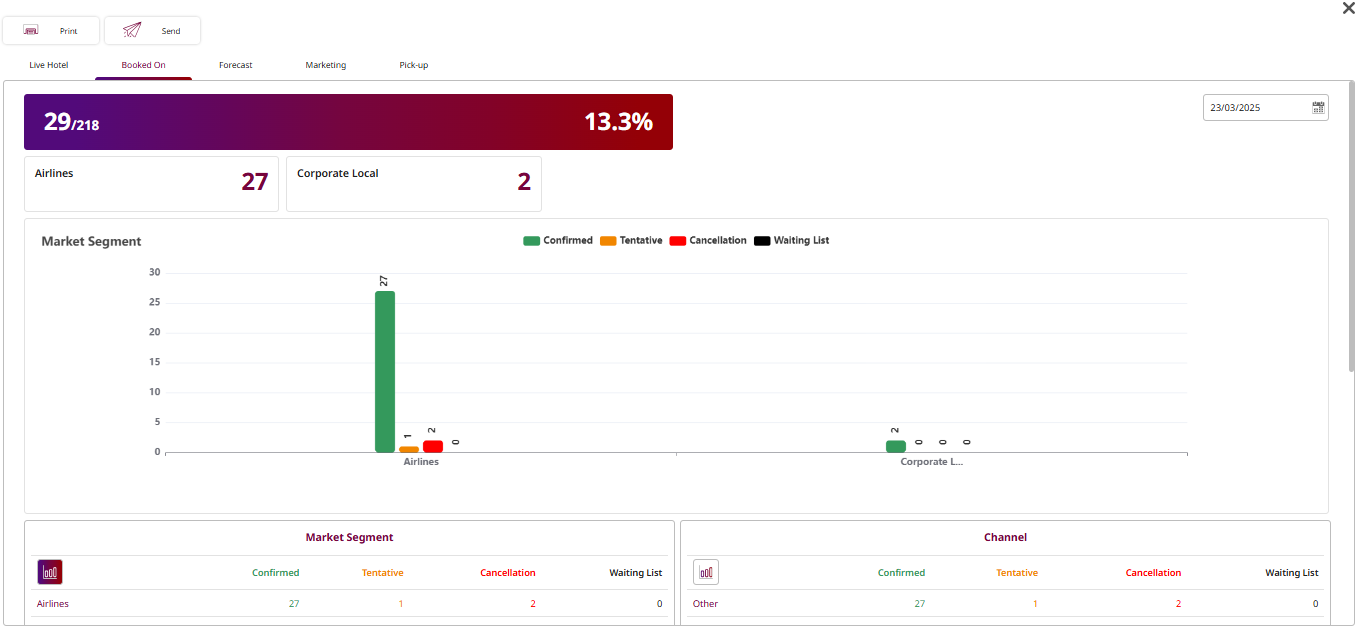
-
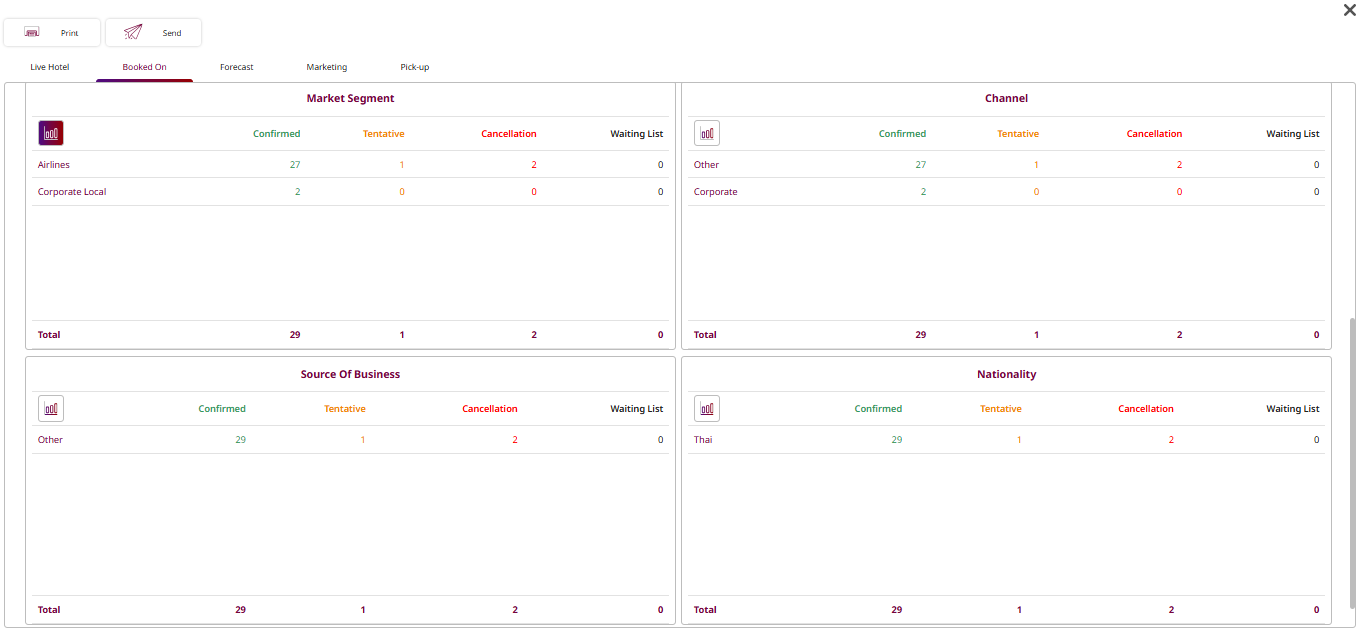
Market Segments : Displays bookings grouped by market segments.
Channel: Displays bookings grouped by sales channel.
Source of Business: Displays bookings by source type.
Nationality: Displays bookings grouped by guest nationality.
- Confirmed : Bookings that are fully confirmed.
- Tentative : Bookings that are tentative and not yet confirmed.
- Cancellation: Bookings that have been canceled.
- Waiting List: Bookings placed on the waiting list.
-
Press Print to generate and print the dashboard report.
Press Send to send the dashboard report via the configured delivery method.
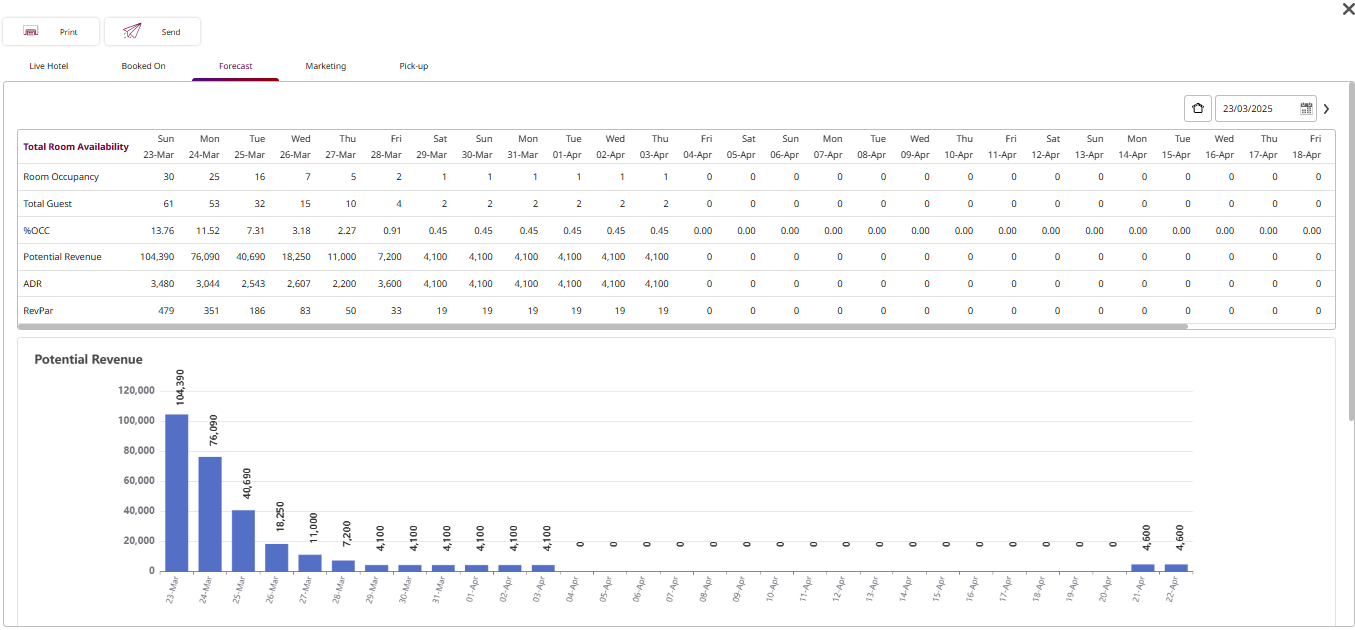
4. Forecast
Available under PMS > Dashboard > Forecast , this function allows staff to view projected room occupancy, guest count, revenue, and key performance metrics for upcoming dates.
To perform the task:
-
Press the Dashboard icon.
-
Press the Forecast tab.
- Room Occupancy : Number of rooms booked for the date.
- Total Guest : Number of guests expected to stay.
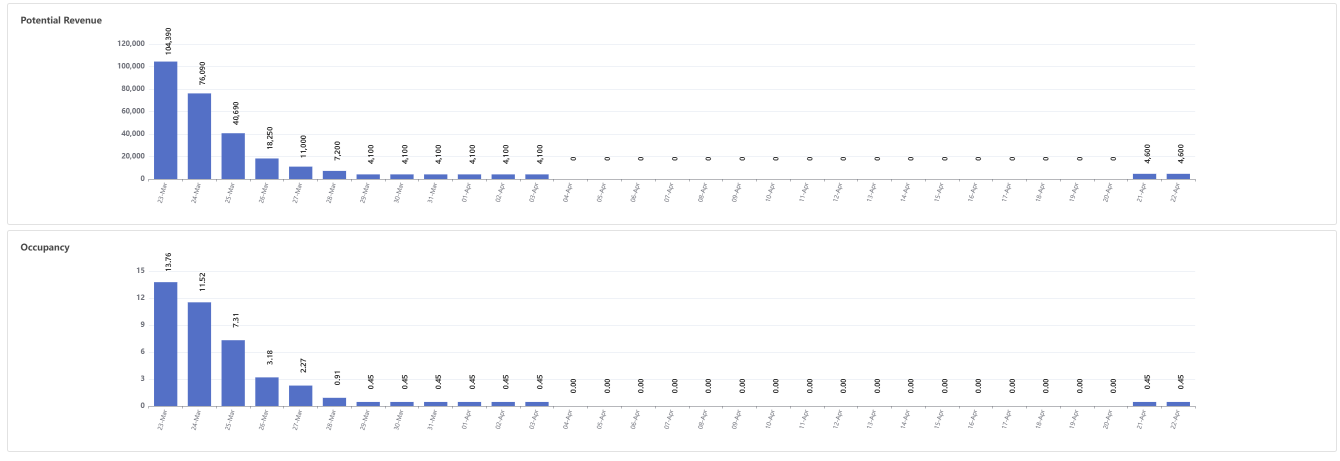
- %OCC : Occupancy percentage for that date.
- Potential Revenue : Total projected revenue based on current bookings and in-house.
- ADR (Average Daily Rate): Average room rate calculated as revenue ÷ occupied rooms**.**
- RevPar (Revenue per Available Room): Average revenue per available room.
-
Press Print to generate and print the dashboard report.
Press Send to send the dashboard report via the configured delivery method.
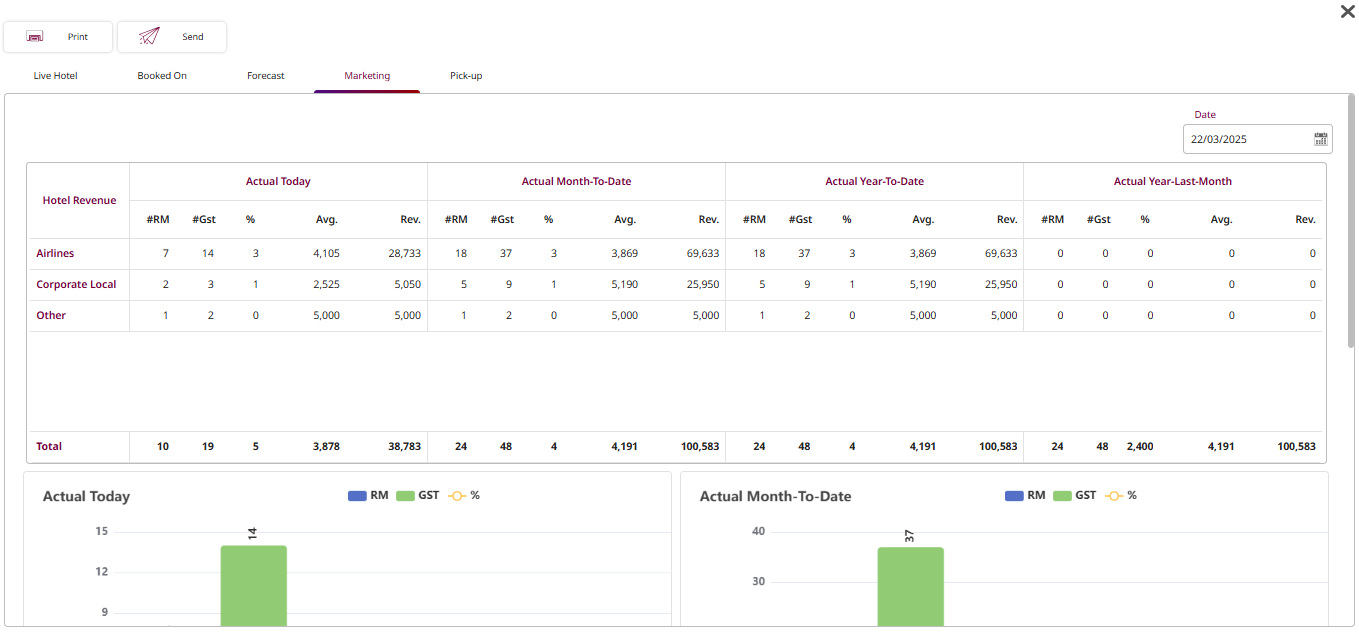
5. Marketing
Available under PMS > Dashboard > Marketing , this function allows staff to monitor and analyze hotel revenue performance across different market segments for various time periods.
To perform the task:
-
Press the Dashboard icon.
-
Press the Marketing tab.
-
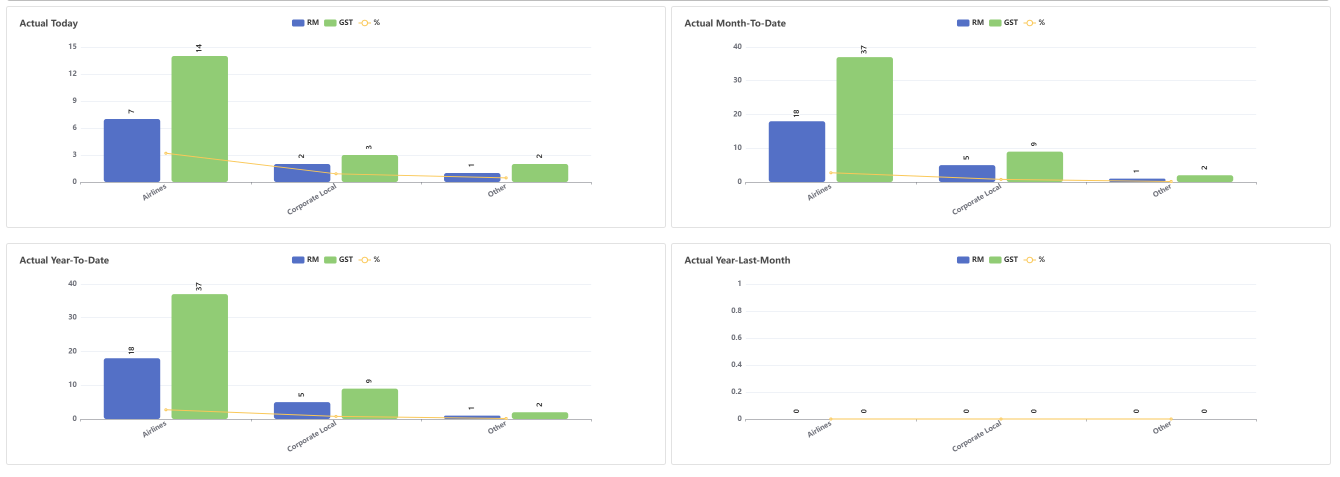
Actual Today – Displays the number of rooms, guests, average rate, and revenue for the current date.
Actual Month-To-Date – Shows cumulative totals for rooms, guests, average rate, and revenue from the start of the month to the current date.
Actual Year-To-Date – Shows cumulative totals from the start of the year to the current date.
Actual Year Last Month – Displays data for the same period last year for comparison.
- #RM : Number of rooms booked.
- #Gst : Number of guests.
- Avg : Average rate.
- Rev. : Total revenue.
-
Press Print to generate and print the dashboard report.
-
Press Send to send the marketing report via the configured delivery method.
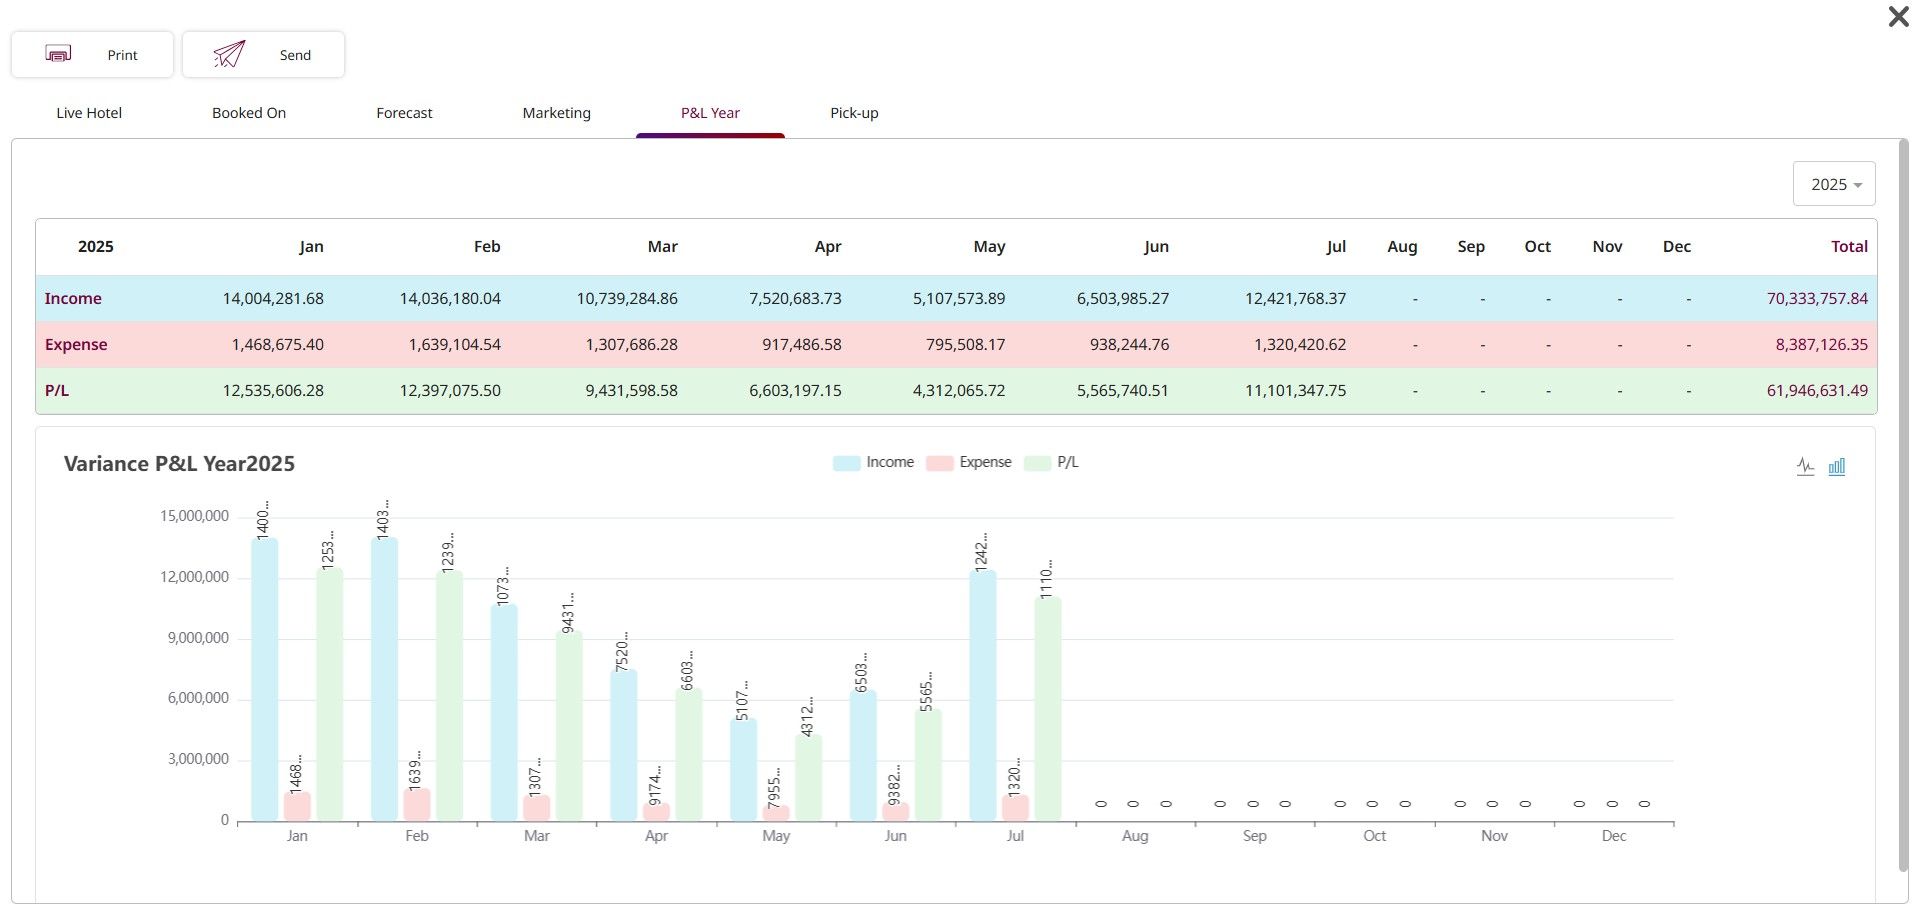
6. P&L Year
Available under PMS > Dashboard > P&L Year , this function allows staff to view an annual summary of the property’s financial performance, including total income, expenses, and profit/loss for each month, along with a visual variance chart.
To perform the task:
-
Press the Dashboard icon.
-
Press the P&L Year tab.
-
Press Year dropdown to select the year for which to view the P&L report.
-
Income (Blue row) – Shows the total revenue for each month.
Expense (Pink row) – Displays the total expenses for each month.
P/L (Profit/Loss) (Green row) – Calculated as: Income − Expense.
Variance Chart – Compare financial performance across months.
-
Press Print to generate and print the dashboard report.
-
Press Send to send the marketing report via the configured delivery method.
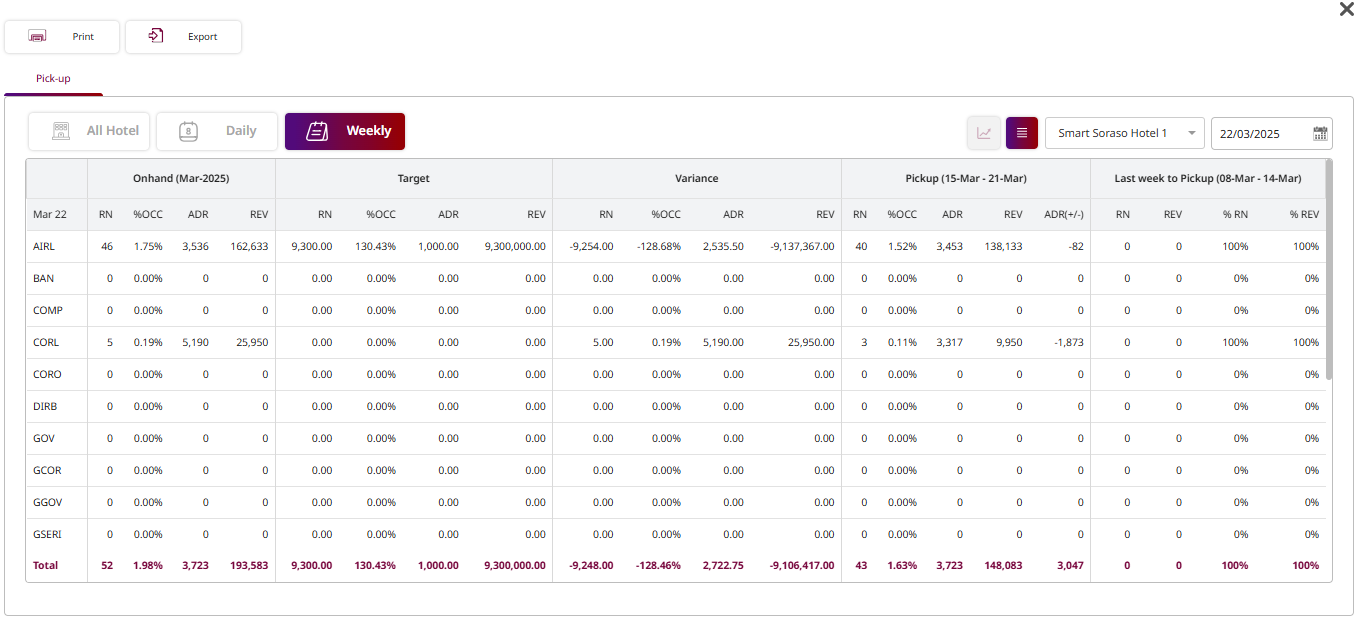
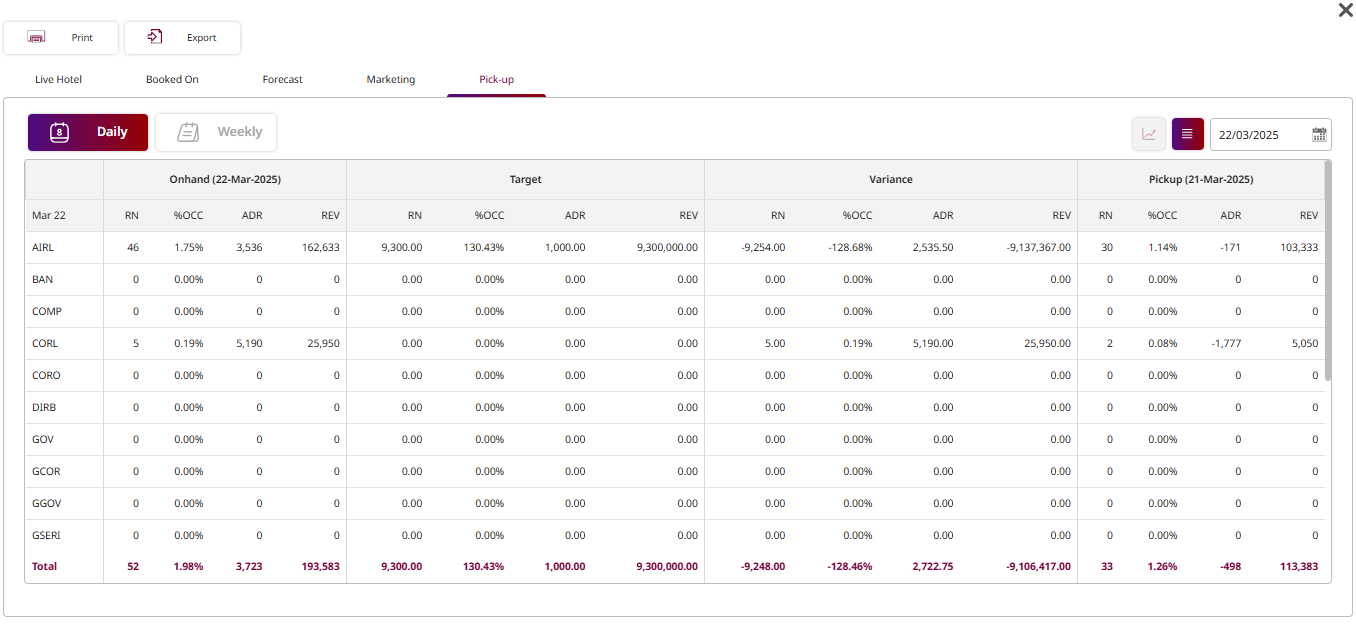
7. Pick-Up
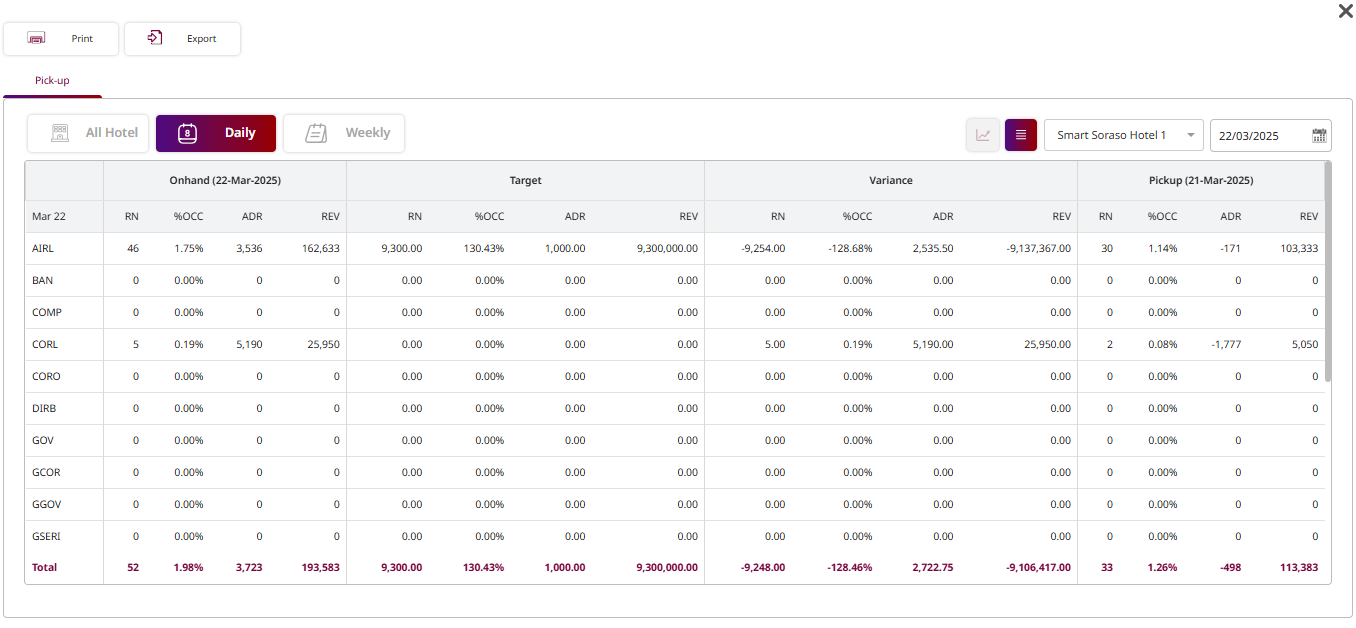
Available under PMS > Dashboard > Pick-Up , this function allows staff to monitor and analyze booking pick- up trends and performance.
To perform the task:
-
Press the Dashboard icon.
-
Press the Pick-Up tab.
-
Daily / Weekly toggle – Switch between daily or weekly pick-up data.
-
Onhand (Selected Date) – Current confirmed bookings on the chosen date:
- RN : Number of room nights.
- %OCC: Occupancy percentage.
- ADR: Average Daily Rate.
- REV: Revenue for that date.
-
Target – The forecast or goal for that date.
-
Variance – Difference between actual onhand numbers and the target.
-
Pickup (Previous Date) – Change in bookings compared to the previous day’s data.
-
Press Print to generate and print the dashboard report.
Press Send to send the marketing report via the configured delivery method.
-
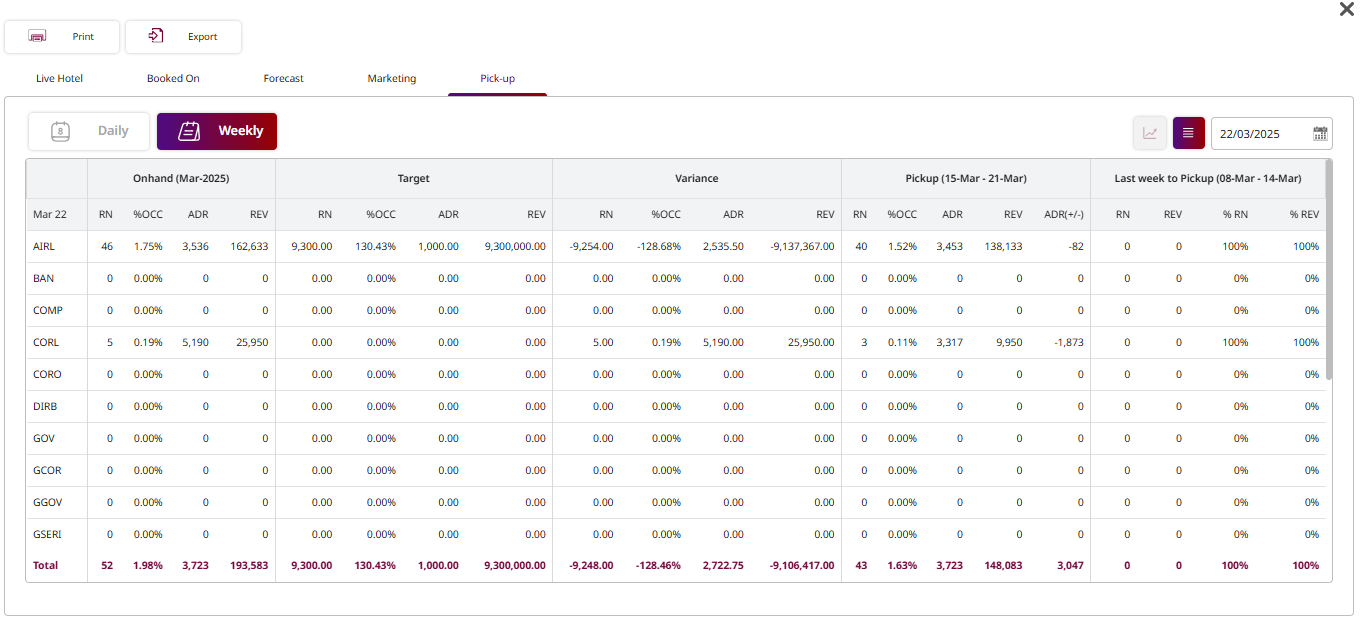
Onhand (Month-Year) – Current confirmed bookings for the selected month:
- RN : Room Nights booked.
- %OCC: Occupancy percentage.
- ADR: Average Daily Rate.
- REV: Revenue generated.
-
Target – Forecast or goal for the same month.
-
Variance – Difference between Onhand and Target values.
-
Pickup – Change in bookings during the last week.
ADR(+/-) – Difference in ADR compared to the previous day/week.
-
Last Week to Pickup – Booking changes from the week before last.
-
Press Print to generate and print the dashboard report.
-
Press Send to send the marketing report via the configured delivery method.
8. Multi Hotel
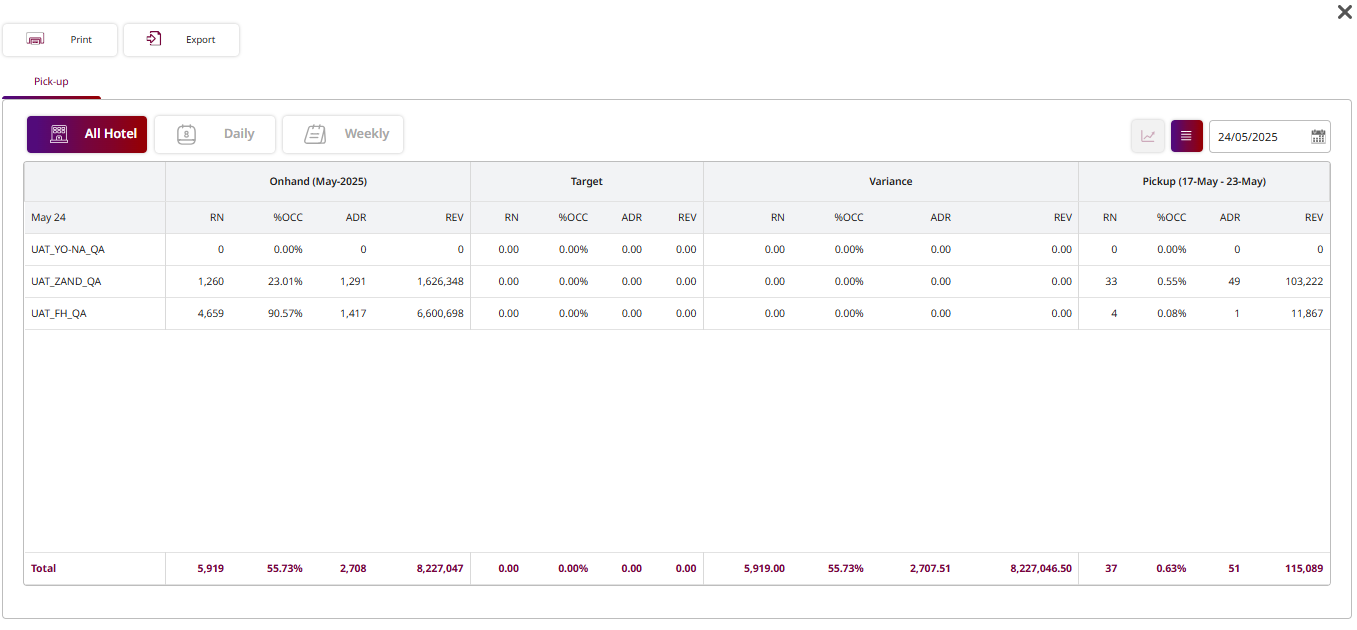
Available under PMS > Pickup > All Hotel , this function allows staff to view and analyze booking pick-up data across multiple hotels simultaneously.
To perform the task:
- Press the Pickup icon.
-
All Hotel / Daily / Weekly toggle – Switch between viewing data for all hotels combined, or by individual date/week.
-
Onhand (Month-Year) – Current confirmed bookings for the selected date:
- RN : Number of room nights.
- %OCC: Occupancy percentage.
- ADR: Average Daily Rate.
- REV: Revenue for that date.
-
Target – The forecast or goal for that date.
-
Variance – Difference between actual onhand numbers and the target.
-
Pickup (Previous Week) – Change in bookings compared to the previous week’s date range.
-
Total – Sums all properties’ data for a quick overview.
-
Press Print to generate and print the dashboard report.
Press Send to send the marketing report via the configured delivery method.
-
Onhand (Selected Date) – Current confirmed bookings on the chosen date:
- RN : Number of room nights.
- %OCC: Occupancy percentage.
- ADR: Average Daily Rate.
- REV: Revenue for that date.
-
Target – The forecast or goal for that date.
-
Variance – Difference between actual onhand numbers and the target.
-
Pickup (Previous Date) – Change in bookings compared to the previous day’s data.
-
Press Print to generate and print the dashboard report.
Press Send to send the marketing report via the configured delivery method.
-
Onhand (Month-Year) – Current confirmed bookings for the selected month:
- RN : Room Nights booked.
- %OCC: Occupancy percentage.
- ADR: Average Daily Rate.
- REV: Revenue generated.
-
Target – Forecast or goal for the same month.
-
Variance – Difference between Onhand and Target values.
-
Pickup – Change in bookings during the last week.
ADR(+/-) – Difference in ADR compared to the previous day/week.
-
Last Week to Pickup – Booking changes from the week before last.
-
Press Print to generate and print the dashboard report.
-
Press Send to send the marketing report via the configured delivery method.